Google has a great tracker table of all of the core algorithm updates they have released to the algorithm for search over the past two years, which is amazing. But being the Google Sheets and Google Looker Studio (formerly Data Studio) fan that I am, I wanted to show you how you can use this data to:
- enhance the reports that you give to your clients or the reporting that you do for your own site
- very quickly map out whether a certain update has had an impact on your search performance
The way that we’re going to do this is we’re going to export the data in a Google Sheets using a very, very simple IMPORTHTML formula, and then we’re going to blend the data with another data source – any traffic metric or data source that you want to use.
So, for instance, if you want to use the traffic metric clicks from Search Console, blend this with this data and see whether your clicks have been impacted by an algorithm update. Similarly, if you want to use your data for sessions from Google Analytics (GA4), again, you will do the same.
Shoutout is to Mehdi Oudjida (@wissi_analytics) from Wissy Analytics for sharing an alternative of this method. If you prefer to watch a video tutorial, check out this YouTube tutorial:
How to Create Looker Studio Charts with Annotations for Google Search Engine Ranking Algorithm Updates
Step 1: Sourcing and Importing SEO Update Data
So the first thing we want to do is to get the URL where the ranking updates are hosted.
Create a new Google Sheet, title it Algorithm Updates, save it wherever you want to. Probably if you’re doing client reporting, it’s good to save it in the drive. And then you use the formula import HTML with the arguments, the first one being the URL, and then we have comma, table, Zero which is the index, and then the locale is EN-US.
Here is the formula:
=IMPORTHTML("https://developers.google.com/search/updates/ranking", "table", 0, "en_US")Once we enter this into the cell it’s important to enter it on the second row, first column, in cell A2, or, or if you have entered it at the top, it’s not really an issue. What we have to do then is add a new row and title it however we want to display this data in Looker Studio:

Pro-Tip: you can also add a column for expert commentary from a senior consultant’s standpoint next to each update, to display in your Looker Studio reports for extra added value.
Also, make sure that the second row (where you entered the formula is hidden (this will enable better integration with Looker Studio down the line).
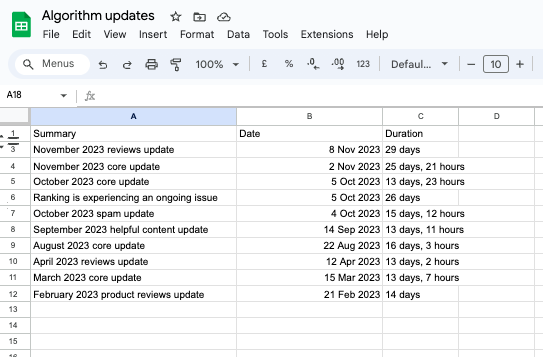
If you want to skip these steps, you can also directly copy this Google Sheets spreadsheet, that already has these formulas and settings: Algorithm Updates
Step 2: Import the Google Sheets data into Looker Studio
And now we have the sheet ready for Google Looker Studio. We can copy the URL, or we will find it directly into Data Studio, and then we head over there. Once we are in Looker Studio, we are going to come to Manage Added Data Sources, Add a Data Sources.
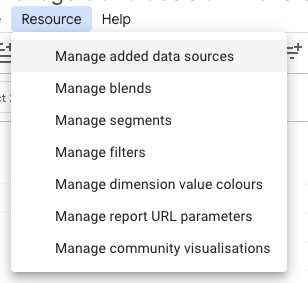
Very important – when you are adding the data source, ensure that you are selecting the option to NOT include the hidden and filtered cells, and only the option to use the first row as titles/ names of the cells.

The reason why we don’t want to include them is because is this will mess up the date dimension because the first thing that Google returns is actually the text for ranking updates release history which is not a date and the way that the table is structured.
And then we are we can go ahead and add this to the report.
Step 3: Create a blended data source
Now let’s say, for instance, we want to report on sessions or maybe we want to report on clicks from Search Console. Today I want to show you how to do that with clicks, but you will see the approach is exactly the same. We have the date, we have the clicks, now what we want to do is blend the data.
So we are going to join another table, we are going to join with algorithm updates, and then we are going to enter in the dimensions: date and algorithm update (and commentary, if you chose to add any).
This is how your blended Data source might look in its most basic form, if you are trying to map out algorithm updates over clicks from Google Search Console.
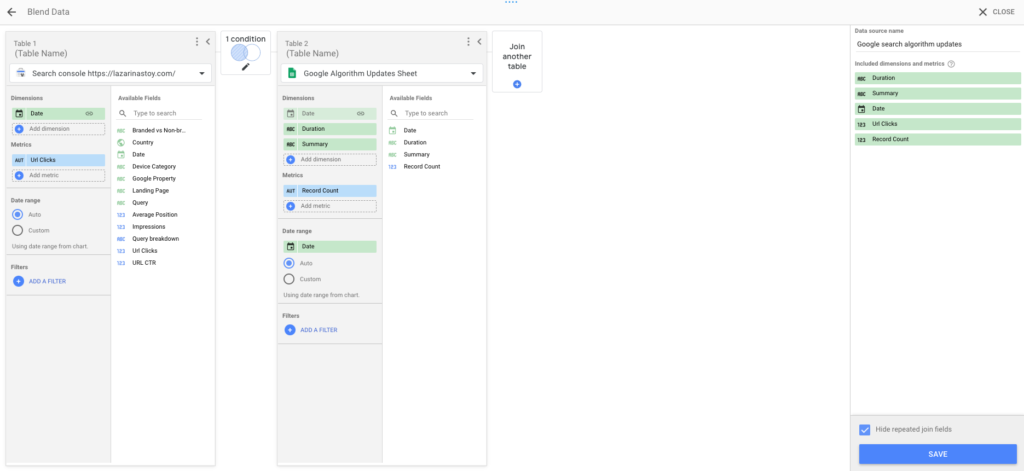
Here you can of course add different dimensions from the main data source, so for instance if you want to add your impressions, your positions, whatever else you want to add, you’re more than welcome to do that.
And this is how it might look like, if you’re trying to map out algorithm updates over Sessions, Engaged Sessions, Bounce Rate, or Purchase Revenue from Google Analytics (GA4) data source. Of course, you can add any metric or dimension here as well.
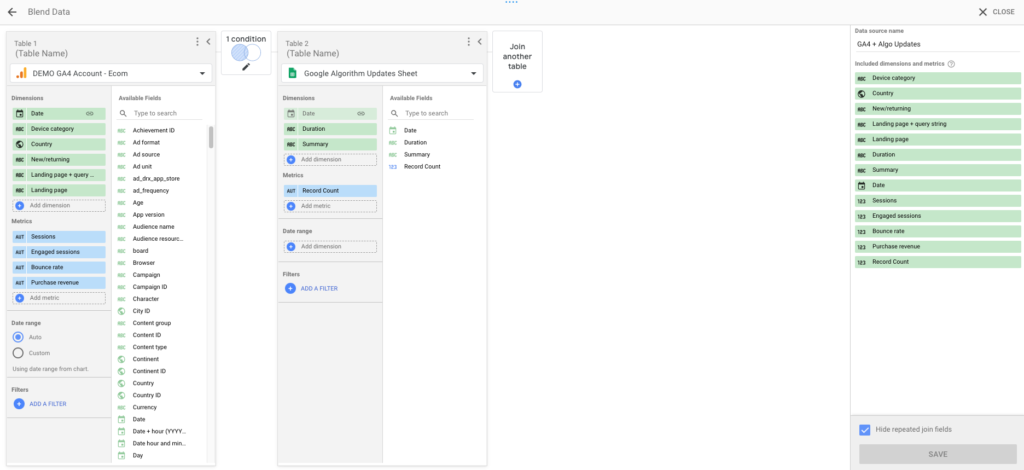
We would like to configure the join as well. We’re going to use left outer join. We have the date dimension in both Data sources that we’re going to use and left outer join, mapping the date as the common dimension.
For those of you that are not aware means that we are taking all of the matching roles using this join. So all of the dates that are contained in the Google search console data source and onto those we are mapping the algorithm updates.
Step 4: Create the Looker Studio chart and configure the display of algorithm updates
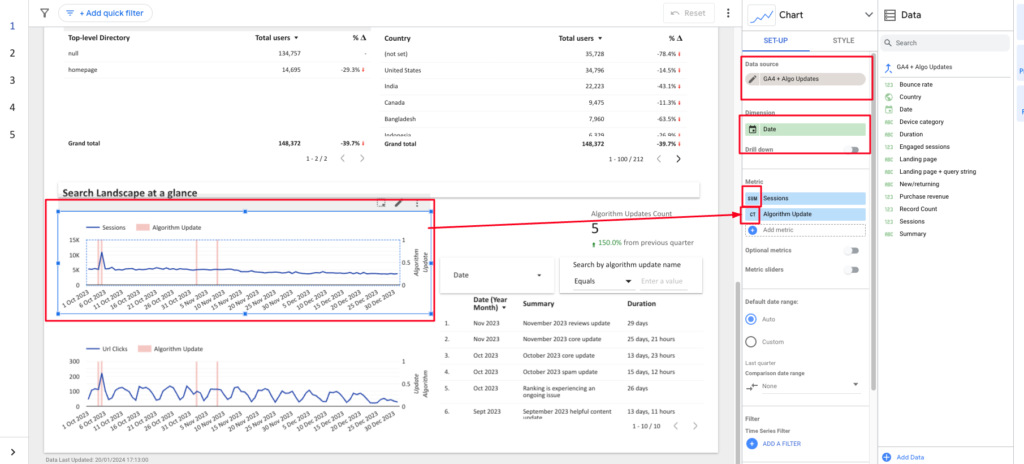
What we want to ensure is that we configure the charts in a way that it shows the following:
- Sessions (from GA4) or any other GA4 metric of your choice, and algorithm updates
- Clicks (from Google Search Console) or any other GSC metric of your choice and the algorithm updates
Here’s what the data settings of your charts should look like:
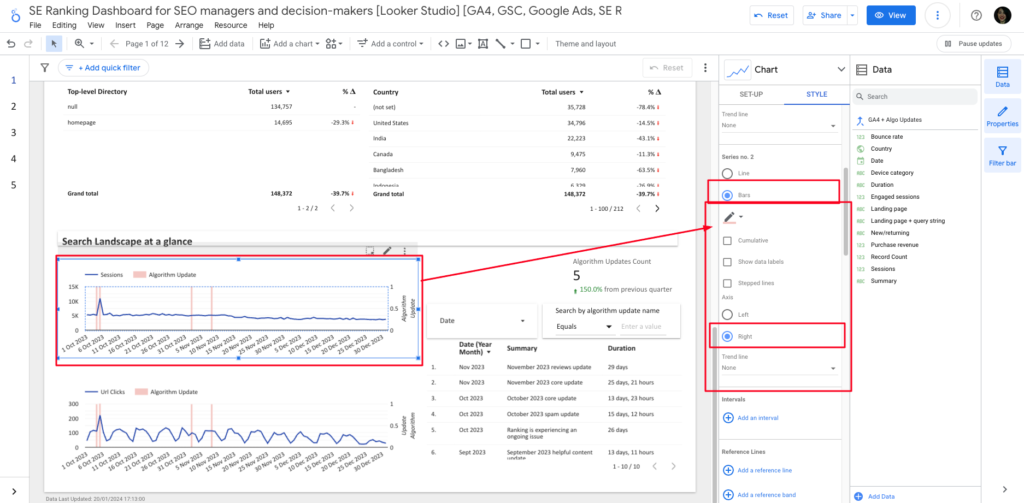
Here’s what the style settings of the chart should look like (to make sure algorithm updates are shown as bars not lines):
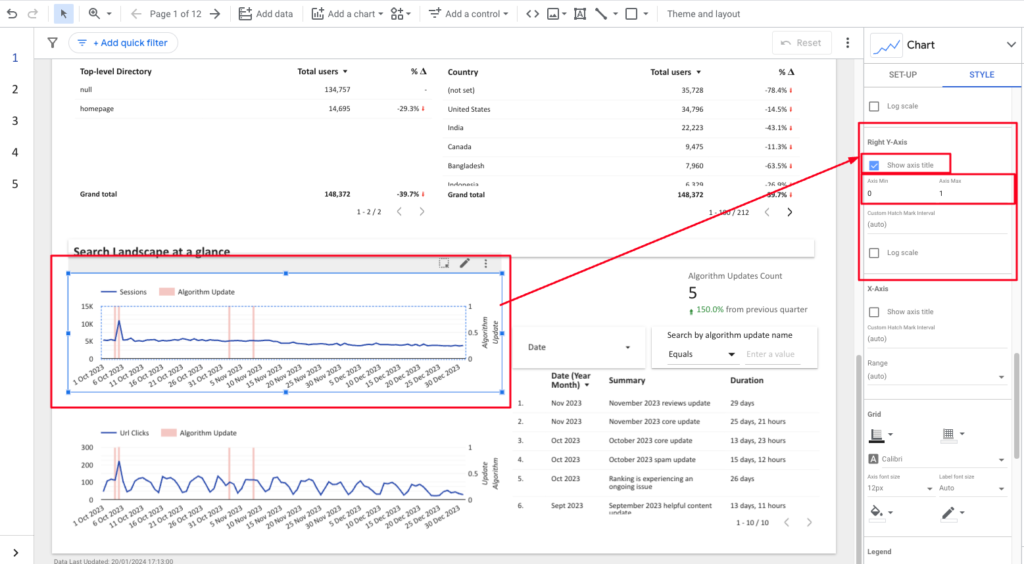
Also, in the style settings, format the Y axis to show the following settings:
The page itself, should also show next to the charts:
- a date filter an a searchable algorithm filter for someone to search per algorithm name, e.g. core update or product update
- a scorecard to count the number of updates in the selected time period
- a filterable table with more details on the algorightm update, the summary of the update, the duration, and expert commentary, if any was added
Here’s a basic structure of how this might look.

Importance of having annotations for Google Algorithm Updates in Looker Studio SEO reporting
Annotations for Google Algorithm updates in the context of traffic reporting for SEO are essential as they allow for a direct correlation between changes in search engine algorithms and fluctuations in website traffic. This specific application enables SEO professionals and website managers to:
- Identify Causation: Understand if a change in traffic is due to an algorithm update or other factors.
- Strategize Adjustments: Quickly adapt SEO strategies in response to the specific nature of the algorithm update.
- Monitor Performance Over Time: Track the long-term effects of algorithm changes on site traffic and rankings.
- Educate Clients/Stakeholders: Provide clear explanations for traffic changes, reinforcing the value of SEO efforts, and improving data storytelling in your dashboard reports
Overall, annotations in Looker Studio add significant value to SEO analysis by providing clear, visual, and contextual insights into how Google’s algorithm changes affect website performance.
Want to learn more ways to add value in your dashboard via data storytelling?
Check out these resources ??


