A step-by-step tutorial for creating negative value custom fields, using SEMrush’s Looker Studio connector and Backlinks History data.
You have some beautiful data, showing loss and gain of the same dimension.
Typically such data is recorded and kept into two separate fields — one showing the loss and the other the gain. Ideally, you’d have one for totals as well.
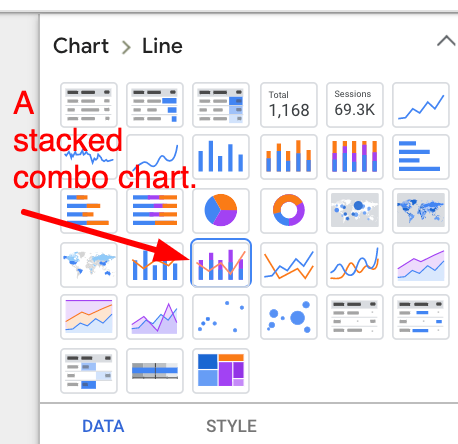
How can you illustrate this beautifully in Google Looker Studio? While there are many ways of doing this, a good one is through a stacked combo chart.
The best way is by illustrating the losses as negative bars below the axes.
That is what this tutorial will show.
1. Connect your data.
Use the SEMrush Data studio connector to import the Backlinks History data to a stacked combo chart.
To import the backlinks history, go to the SEMrush Domain Analytics.
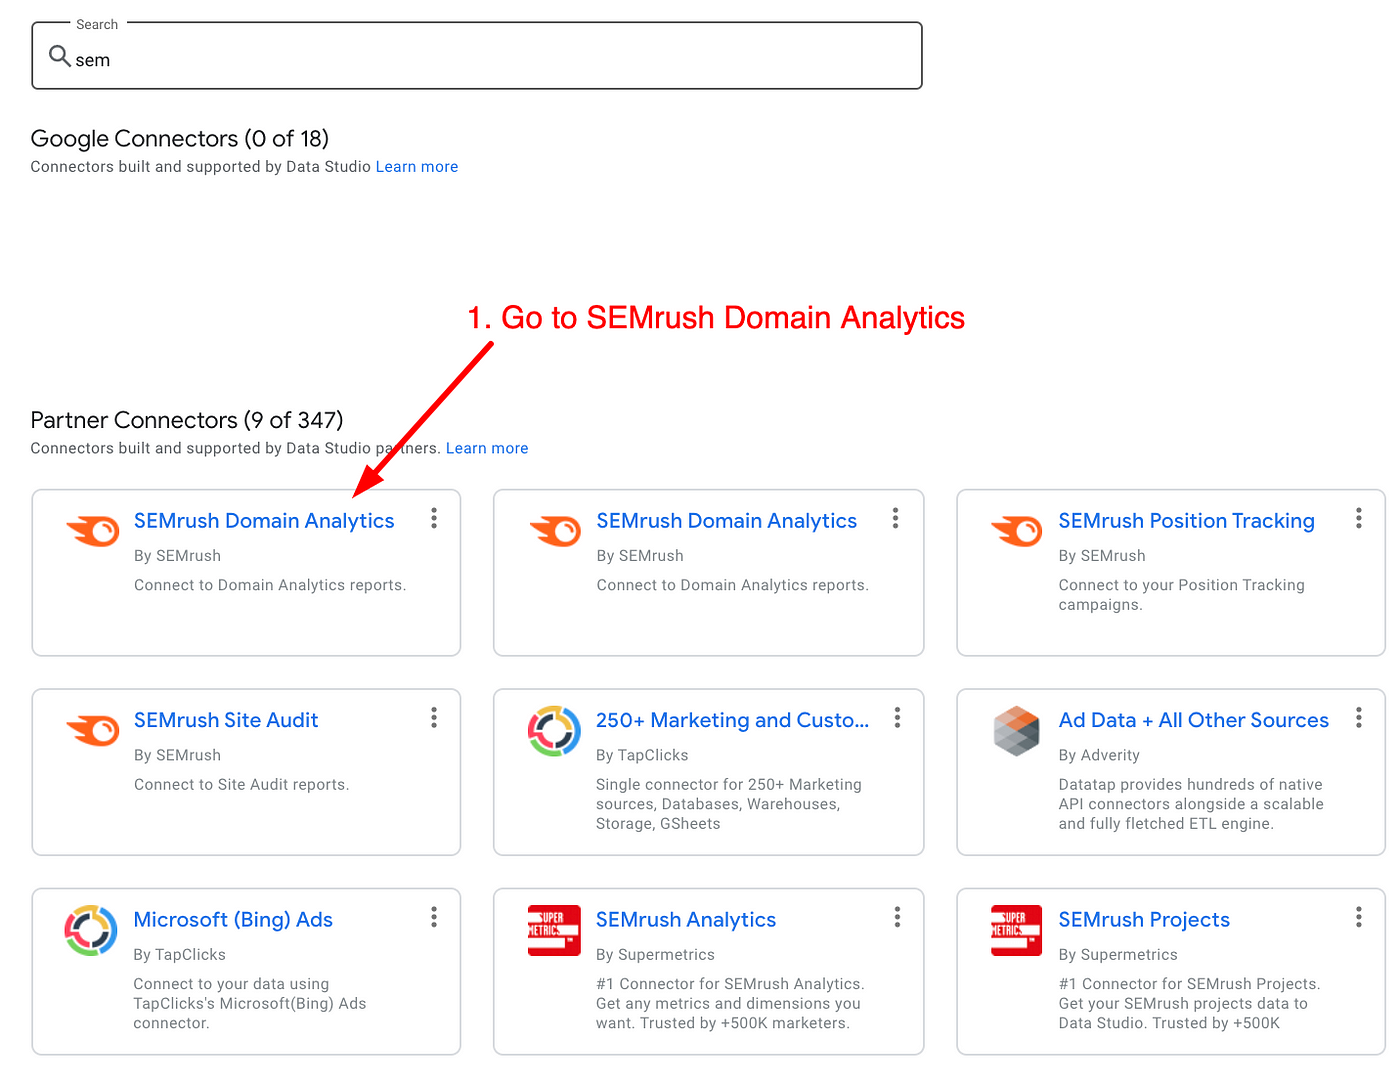
Then, select the Backlinks: History report type.

Finally, enter the domain you want to pull data for.
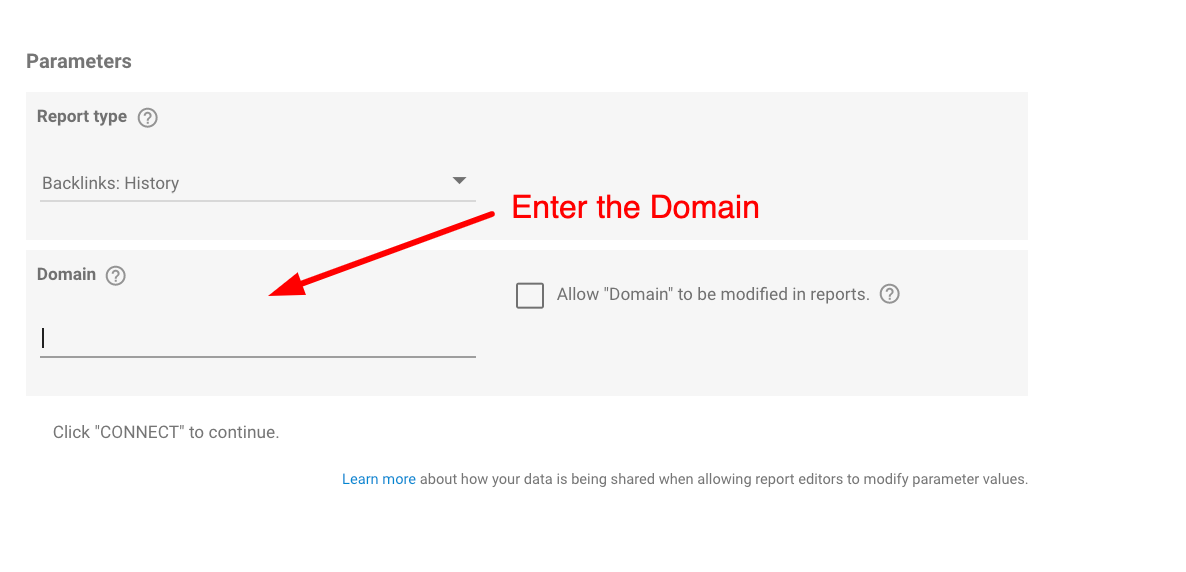
2. Configure your chart.
When the data is first imported, it will have three fields for backlinks and another three for referring domains, which can be illustrated using the date dimension.
Here is the full list of available fields.

A stacked combo chart, as illustrated by SEMrush, however, requires the creation of two additional fields, which will enable the demonstration of Lost Backlinks and Lost Referring Domains as negative numbers on the chart.
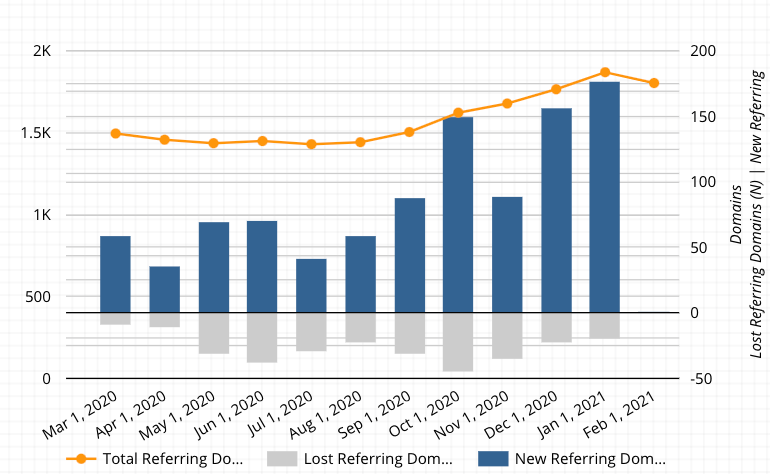
This is how the chart should look like, as per SEMrush’s demo report:
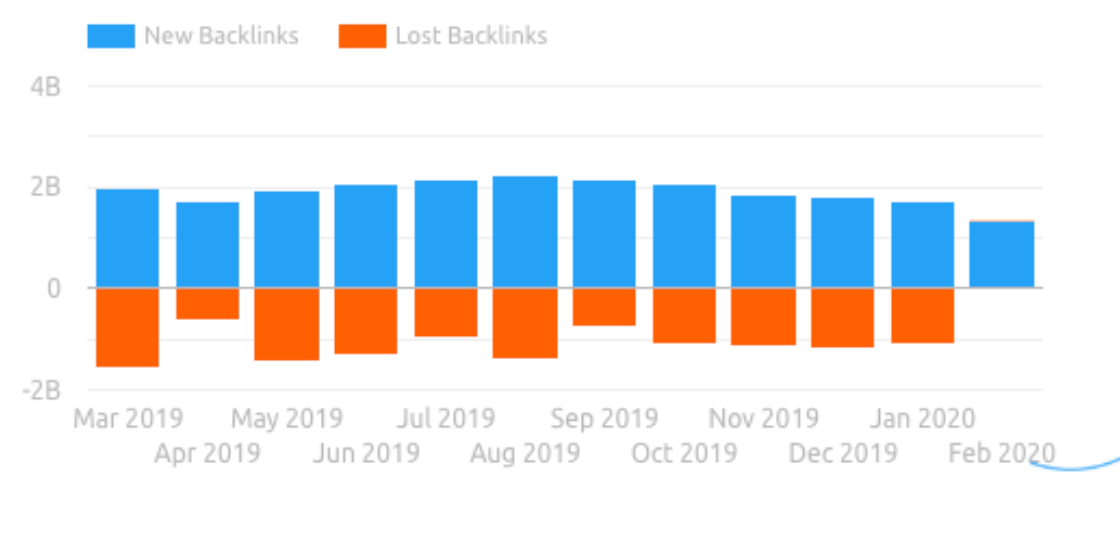
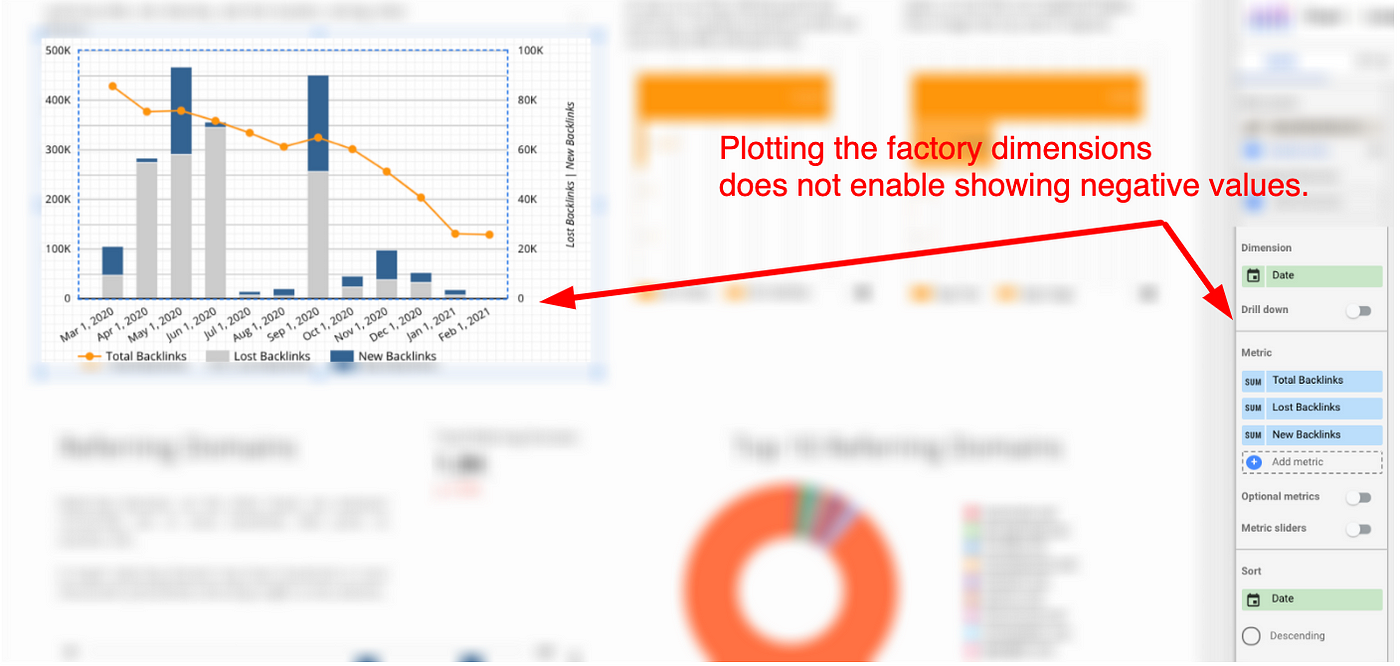
If we just plot the built-in dimensions, provided by SEMrush, we will not be able to illustrate the negative values on the chart for lost backlinks, as they are recorded in the dimensions as positive values.
Google Data Studio also has some advice about displaying negative numbers in charts:
Set Axis min to (auto) to display negative and mixed values in charts.
This will not help if the numbers in the fields are not themselves negative, though.
Instead, we can create a custom field to represent the same dimension (‘Lost Backlinks’) as a negative value.
3. Create a custom field.
To create a custom field, click on the ‘Add a field’ button on the bottom right.
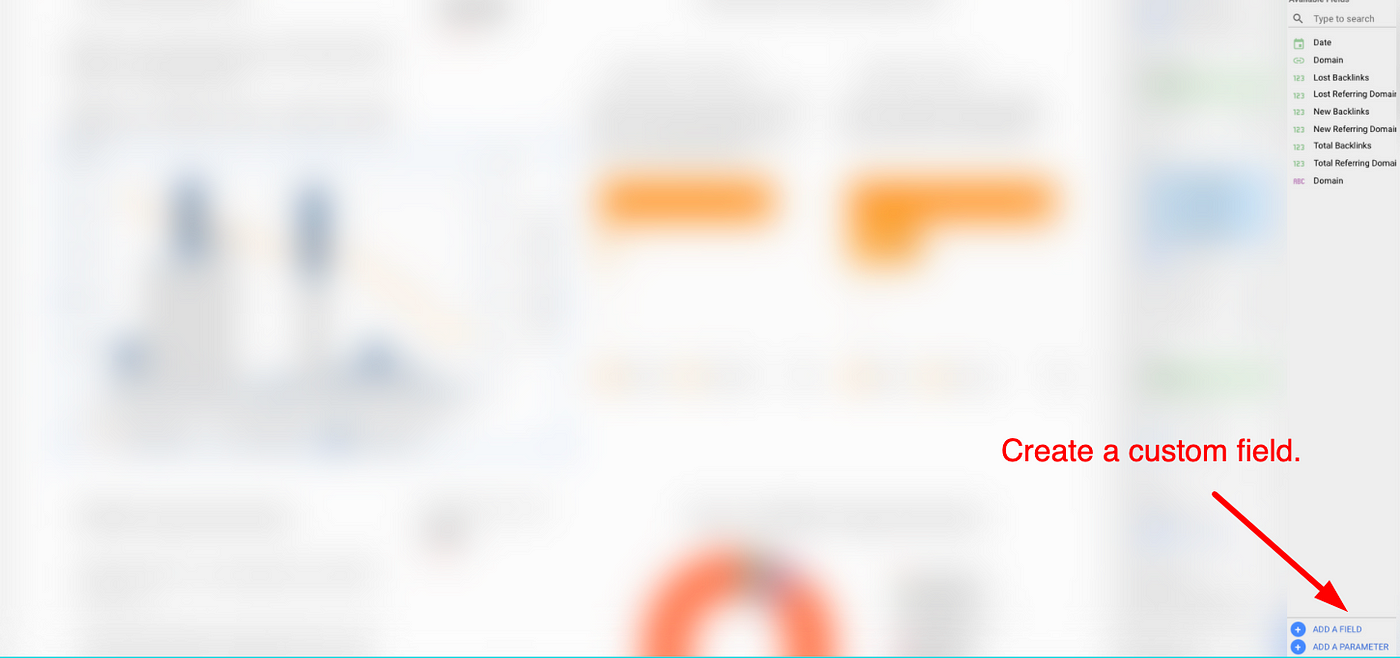
To illustrate the lost backlinks as a negative number, we can create a custom field that subtracts the lost backlinks dimension out of 0.
To do this, insert the formula below.

Assuming you’d like to create the same view for the referring domains, repeat the process, using the lost referring domains field as well.
4. Replace the built-in dimension with your custom field.
Finally, replace the built-in dimension in the chart with your custom dimension.
Both charts should now look like this.
To sum up…
This type of problem is quite common, so I hope this quick tutorial helps you create better charts in Google Data Studio.
To illustrate a negative number on a chart in Google Data Studio, where you only have a field that contains the number as a positive, you’d need to create a custom field, which subtracts the number out of 0.


